
Monte Carlo
Founded Year
2019Stage
Series D | AliveTotal Raised
$236MValuation
$0000Last Raised
$135M | 3 yrs agoMosaic Score The Mosaic Score is an algorithm that measures the overall financial health and market potential of private companies.
-46 points in the past 30 days
About Monte Carlo
Monte Carlo provides a data observability platform that detects, resolves and prevents data downtime, providing visibility and interoperability between data tools. Monte Carlo primarily serves sectors such as financial services, healthcare and life sciences, technology, advertising, media, and entertainment. The company was founded in 2019 and is based in San Francisco, California.
Loading...
Monte Carlo's Product Videos

ESPs containing Monte Carlo
The ESP matrix leverages data and analyst insight to identify and rank leading companies in a given technology landscape.
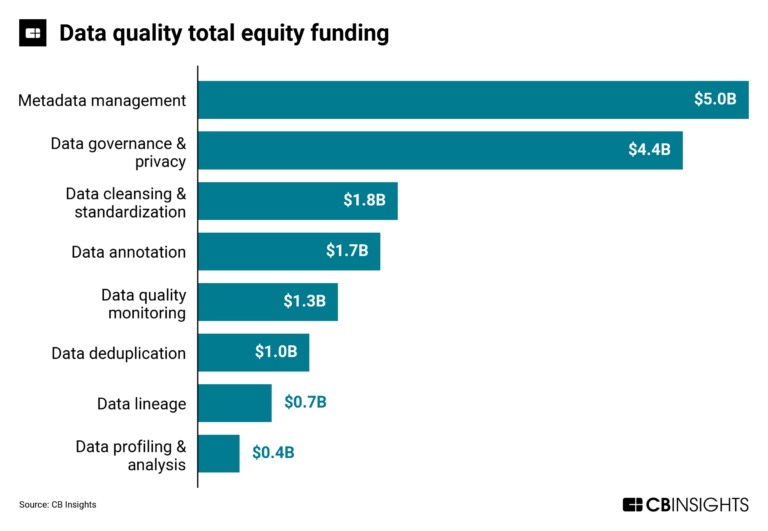
The data quality monitoring market offers a range of tools and platforms designed to help organizations measure, fix, and use trusted data in their day-to-day operations. It involves continuous monitoring and analysis of data to detect and resolve issues promptly, as well as the establishment of metrics and performance indicators to measure and track data quality over time. By automatically monito…
Monte Carlo named as Outperformer among 15 other companies, including IBM, Snowflake, and Databricks.
Monte Carlo's Products & Differentiators
Monte Carlo Data Observability Platform
Monte Carlo’s Data Observability Platform automatically monitors and alerts for data issues across your warehouses, lakes, ETL, and business intelligence tools. Monte Carlo also provides automatic, field-level lineage, root cause analysis, and centralized data cataloging to better understand the accessibility, location, health, and ownership of their data.
Loading...
Research containing Monte Carlo
Get data-driven expert analysis from the CB Insights Intelligence Unit.
CB Insights Intelligence Analysts have mentioned Monte Carlo in 3 CB Insights research briefs, most recently on Jul 31, 2023.
Jul 31, 2023
The data quality market map

Expert Collections containing Monte Carlo
Expert Collections are analyst-curated lists that highlight the companies you need to know in the most important technology spaces.
Monte Carlo is included in 3 Expert Collections, including Unicorns- Billion Dollar Startups.
Unicorns- Billion Dollar Startups
1,257 items
AI 100
100 items
Artificial Intelligence
7,146 items
Latest Monte Carlo News
Jan 17, 2025
Abstract Cumulative risk assessment is significant for evaluating the combined exposure to multiple substances, but its widespread acceptance and application have been limited due to the complexity of clarifying and assessing actual exposure. In this study, we conducted a cumulative risk assessment based on hazard-driven criteria to evaluate the co-exposure to elemental contaminants in the diet of the population in Chongqing Municipality. The cumulative risk was calculated and evaluated using Monte Carlo modeling and the modified Reference Point Index (mRPI) method. Neurotoxicity and nephrotoxicity were identified as the main toxic endpoints, and the final evaluation elements included were Pb, Cd, As, and Hg. The results showed that the combined mRPI values for neurotoxicity and nephrotoxicity, resulting from exposure to the four heavy metals, ranged from 0.922 to 4.835 and 1.306 to 7.031, respectively. Cd and Pb were the primary contributors to nephrotoxicity, while Pb was the main contributor to neurotoxicity. The results indicated that combined dietary exposure to Pb, Cd, As, and Hg may pose risks of neurotoxicity and nephrotoxicity, with the combined exposure likely amplifying this risk compared to exposure to individual heavy metal elements. mRPI proves to be a more suitable index for cumulative risk assessment using a hazard-driven approach compared to other indexes, as it is derived based on specific studies and endpoints. Introduction Findings based on human biomonitoring have demonstrated that human are exposed to chemicals via the air, water and food, which may pose a risk to our health. Over the last decade, regulatory bodies have attached importance to mixture risk assessment. A series of guidelines and technical documents have been published by scientific advisory bodies, e.g., European Food Safety Authority (EFSA), US Environmental Protection Agency (US EPA) and World Health Organization (WHO) to stress the importance of evaluation of the potential combined toxicity of chemicals co-existing with humans and provide methodological guidance of mixture risk assessment 1 , 2 . However, due to the use of large amounts of chemicals and the limited information available on toxicity, as well as the infinite potential combinations, the evaluation of multi-chemicals remains challenging 3 . Recent scientific progress has contributed to a better understanding of mixture effects and the development of new approaches for assessing risks from joint exposures to mixtures. Substantial strides have been made in conceptual approaches to address mixture risks, and New Approach Methodologies (NAM) data have been considered as selectable sources of toxicity information potentially relevant to human health risk assessment. As one of the NAMs, Adverse Outcome Pathway (AOP) has recently presented itself as a crucial tool for classifying chemicals into evaluation groups and informing the evaluation of data-poor chemicals. While some evaluations of mixtures have been carried out by scientific bodies such as the Joint Meeting on Pesticide Residues (JMPR), the Joint FAO/WHO Expert Committee on Food Additives (JECFA), and US EPA for food additives, pesticides, veterinary drugs, and co-occurring contaminants, most of them were limited to chemicals with similar structures and physicochemical properties. In May 2021, EFSA issued two methodological guidance documents on scientific criteria for grouping chemicals into assessment groups using hazard-driven criteria and methods of prioritization using exposure-driven and risk-based approaches 4 . Prior to that, EFSA Panel on Plant Protection Products and their Residues (PPR) published two scientific reports on the establishment of cumulative assessment groups of pesticides for their effects on the nervous system and the thyroid in 2020 5 , 6 . These documents may indicate an emerging paradigm shift in chemical mixture risk assessment. The human body can be exposed to various types of heavy metal elements simultaneously through ingestion, drinking water, air and skin contact. Numerous studies have shown that multiple heavy metal elements can be detected simultaneously in food, and biomarker-based studies confirm that the human body is chronically exposed to various heavy metals 7 , 8 . Beyond the risks associated with excessive exposure to a single element, simultaneous exposure to multiple heavy elements within permissible limits may also pose hazard. In recent years, an increasing number of studies have reported that co-exposure to low doses of metallic elements may lead to harmful effects, such as multiple organ damage and neurobehavioral alterations, which can result from exposure to cadmium (Cd), lead (Pb), and mercury (Hg), at environmental exposure levels 9 . Most heavy metal elements, including Cd, arsenic (As), Hg and Pb, can adversely affect the renal and nervous systems with prolonged low-dose exposure 10 , 11 , 12 , 13 . Studies indicated that co-exposure to Cd and Pb or As and Cd leads to more pronounced renal injury and dysfunction than exposure to each element alone. This early co-exposure may also contribute to the development of chronic renal disease (CKD), end-stage renal disease (ESRD), or renal dysfunction 14 , 15 , 16 . A study by Wang et al. also showed that Pb, Cd, As and Hg damage the renal tubules, potentially leading to reduced glomerular filtration rate and/or tubular dysfunction, as well as other renal impairments 17 . Similarly, Claire et al.. found that Pb, Cd, As and Hg all affect the dopamine system in different ways, thereby interfering with normal neurotoxic function 18 . Moreover, several population-based studies suggested that long-term co-exposure to Pb, Cd, As and Hg is associated with kidney damage, cognitive impairment, and other damaging effects 7 , 19 . However, only a small number of studies have evaluated the cumulative risk of heavy metal elements. Almost all of them rely on subjective grouping approach or do not consider all substances in their risk calculations. This may lead to an overestimation of risk due to differences in the mode of toxic action and target organs among different metallic elements, or an underestimation resulting from limited number of elements in an assessment. Therefore, this study will adopt hazard-driven approach for risk assessment and primary screening of heavy metal elements based on exposure drivers, which may offer more accurate estimation of risk compared to other studies. Soil heavy metal pollution has emerged as a serious and widespread issue in China. The 2014 China Soil Pollution Survey showed that the exceeding standard rates of soil heavy metals was 16.1% 20 . Specifically, Cd, Hg, As and Pb inorganic pollutants exceed the China national standard levels at rates of 7.0%, 1.6%, 2.7%, and 1.5%, respectively 20 . Located in southwest China, Chongqing holds significant importance as an industrial center, a national historical and cultural city, a vital modern manufacturing base, an economic center in the upper reaches of the Yangtze River, and an international consumer center. Consequently, heavy metal pollution’s impact on the environment and food safety in Chongqing represents a crucial public health concern. Some studies have revealed varying degrees of Cd, As, Pb and Hg pollution in the soil of Chongqing’s main urban areas, as well as certain districts and counties 21 , 22 . Additionally, the rivers in the main urban areas of Chongqing have shown Cd, Cr (chromium), Cu (copper) and other metal levels reaching the threshold of mild pollution and higher, and the substrate has also been contaminated to some extent by heavy metal elements such as Pb and Cd 23 , 24 . According to a survey conducted by Wu et al. 25 , hazardous heavy metal elements such as Pb, Cd, and Hg were detected in over 50% of commercially available food products in Chongqing. Specifically, the detection rate of Cd in cereals and their products was 93.33%, while As was detected in 100.00% of aquatic animals and their products as well as milk and dairy products. Hg was found in 99.07% of milk and dairy products, and some samples exceeded the permissible standards. Therefore, in order to determine the level of heavy metal exposure and its associated health risks, there is an urgent need to conduct a cumulative risk assessment of Chongqing residents. In the present study, we performed a cumulative risk assessment of heavy metal contaminants among Chongqing residents using a hazard-driven approach. The research aimed to achieve two primary objectives: (1) quantifying the exposure levels of heavy metal contaminants in commonly available foods in Chongqing and assessing the potential cumulative health risk; (2) investigating the applicability of the method for risk characterization in cumulative risk assessment. Study findings will be used to inform policy interventions and food safety regulation in Chongqing. Additionally, they can contribute with the development of the method of multiple chemicals risk assessment. Materials and methods Screening and grouping of heavy metal elements In this study, we utilized the heavy metal pollutant monitoring data from the food safety risk monitoring system of Chongqing Municipality spanning from 2017 to 2021. Hazard data for heavy metal elements are collected from previous JECFA assessments and EFSA assessments, available open databases and published research papers (detailed retrieval process are shown in supplementary materials Appendix A). The heavy metal elements meeting our screening criteria were identified as the subjects of this study. Our selection criteria were guided by the following principles: a. b. Exclusion of heavy metal elements not concurrently monitored in the three most commonly consumed food categories (cereals and cereals products, vegetables and vegetables products, and meat and meat products); c. Exclusion of heavy metal elements with estimated dietary exposure below 10% of the relevant health-based guidance value (HBGV), applicable only to heavy metal elements with HBGV. Following this initial screening, the chosen heavy metal elements were categorized based on hazard driven principles, taking cues from EFSA Scientific Committee guidelines 26 . The categorization primarily adhered to the following principles: a. b. c. In cases where AOP/MOA information is missing or available, grouping chemicals that conduct a common toxic effect (e.g., impaired immune function) or exhibit similar target organ toxicity. Food contamination data All concentration data of heavy metal elements in food were obtained from the 2017–2021 China National Food Contamination Monitoring Program (The databases is closed and the data are available from the corresponding author on reasonable request). According to the China national standards, food samples were divided into 10 categories, including cereals and cereal products (rice, rice products, wheat grains and flour, wheat products, other cereal and cereal products), vegetables and vegetables products (leafy vegetables, root and tuber vegetables, stem vegetables, brassica vegetables, legumes vegetables, other fresh vegetables, vegetable products), nuts, fruits, beans and bean products (beans, bean products), meat and meat products (livestock meat, poultry meat, meat products, edible livestock and poultry offal), fish and their products, eggs and their products, milk and dairy based products, and foods for special dietary uses 27 . All food samples were collected using a multi-stage stratified random sampling method from retail stores, large and medium-sized supermarkets, grocery stores, farmers’ markets and convenience stores in 38 districts and counties of Chongqing. Sample handing and analysis In accordance with dietary habits, samples were collected from the edible portion of food. Solid samples, such as grain and beans, were cleaned of debris, crushed into uniform samples, and stored in sealed plastic bottles. Fresh samples, including vegetables, fruits, meat, fish, and eggs, were washed, dried, and the edible portions were homogenized into a paste. These were then stored in plastic bottles and kept in the refrigerator at -16 to -18 ℃ for future use. The samples were pre-treated and analyzed following national standards (e.g., GB 5009.11–2014, GB 5009.12–2017, GB 5009.15–2014, GB 5009.17–2014, GB 5009.123–2014 and GB 5009.268–2016 28 , 29 , 30 , 31 , 32 , 33 . Briefly, solid sample weighing 0.2 g to 0.5 g (accurate to 0.0001 g) or liquid sample measuring 1.0 mL to 3.0 mL were precisely transferred into the microwave digestion tank. Nitric acid (5 mL to 10 mL) was added, and the containers were covered and left for 1 h or overnight. Afterward, the digestion process was carried out according to the standard procedure. Once cooled, the containers were removed, and the volume was adjusted to the scale line using a 1% nitric acid solution or water. The contents were thoroughly mixed and set aside, with simultaneous blank testing. The heavy metal elements’ contents in food samples were subsequently analyzed by a qualified regional laboratory under the local Centers for Disease Control and Prevention (CDC). This analysis was conducted using Atomic Absorption Spectrometry (AAS) or Atomic Fluorescence Spectrometry (AFS), or Inductively Coupled Plasma Mass Spectrometry (ICP-MS). All operations followed the standard operating procedures (SOP) established by the organizers. Uniform quality control and oversight is provided by the National Monitoring Program of China (NMPC). Each laboratory must comply with the quality control requirements, including the simultaneous analysis of certified reference materials alongside the samples. All data are ultimately sent to the NMPC and rechecked before they were used. Concentration conversion method The data on Hg and As were analyzed as total Hg and total As. Conversion factors are used to derive inorganic As (iAs) from total As data and methylmercury (MeHg) or inorganic Hg (iHg) levels from total Hg data. According to a study by Suomi et al. 34 , 2% of the total As is iAs in fish and 70% in other foods. For Hg, the assumptions aligned with those used by EFSA 13 . Assuming that the conversion coefficient between total Hg and MeHg in fish is 100%; in the food group other than fish, the conversion coefficient between total Hg and MeHg is 0%. Assuming that the conversion coefficient between total Hg and iHg in fish is 20%; in the food group other than fish, the conversion coefficient between total mercury and iHg is 100%. Consumption data sources The dietary consumption data was obtained from the 2018 China Health and Nutrition Survey of Chongqing municipality. A total of 969 study participants were surveyed from 6 survey sites (Shapingba, Fengjie, Dazu, Jiangjin, Qijiang, Nanan districts or counties of Chongqing) using multi-stage stratified random sampling approach. Among the respondents, 432 (44.6%) were male and 537 (55.4%) were female. The age distribution included 31 preschoolers aged 3 to 6 (3.2%), 113 adolescents aged 7 to 17 (11.7%), 399 adults aged 18 to 59 (41.2%) and 426 adults aged 60 or older (43.9%). The survey was conducted using a three-day, 24-h dietary recall method, in which well-trained dietary surveyors visited households daily to collect information on what individuals were eating. For survey respondent under 7 years old or over 75 years old, dietary information was obtained from adult family members. The food consumption of each food category consumed by each survey respondent during the survey period was summed up to calculate the average food consumption of each food category. Ethical approval This study was conducted in accordance with the approval of the Chongqing Center for Disease Control and Prevention (KY-2023-024-2). All methods were performed in accordance with relevant guidelines and regulations and informed consent was obtained from all participants and/or their legal guardians. Exposure risk assessment method Methods for handling left-censored data To account for uncertainties arising from left-censored data, lower bounds (LB), median bound (MB) and upper bounds (UB) were calculated. According to EFSA’s recommended treatment for left-censored data 35 , values below the limit of detection (LOD) were set to zero in the LB, 1/2 LOD in the MB and LOD in the UB. Two scenarios were estimated for Chongqing residents, mean and high exposure. In a high exposure scenario, we assumed that 95th percentile of individual exposure levels would substitute for high exposure. Exposure assessment The dietary exposure to heavy metals per kilogram per day for an individual was calculated using the following formula: $$\:EDI={\sum\:}_{j=1}^{n}\frac{{F}_{j}\times\:{C}_{j}}{{BW}_{i}}$$ where the estimated daily intake (EDI) refers to the level of dietary exposure to heavy metals per kilogram of body weight per day for individual (i); Cj is the level of heavy metal contamination in food category j (µg/kg); Fj is the daily consumption of food category j (g/d); BWi is the body weight of an individual (i). Risk characterization The cumulative health risk of Chongqing residents from dietary exposure to heavy metals was assessed using the modified Reference Point Index (mRPI) method, which is an easily applicable and transparent food pollutant accumulation risk assessment method 36 , 37 . Moreover, mRPI combines the advantages of both Hazard Index and Reference Point Index methods. This approach uses dose addition as a default assumption and does not consider interactions between substances. The reference point index of a single element pollutant is called the reference point quotient (RPQ). The reference point quotient is the ratio of estimated daily intake (EDI) to toxicological reference points (RP), calculated using the following formula: $$\:{RPQ}_{i}=\frac{{EDI}_{i}\times\:{UF}_{i}}{{RP}_{i}}$$ where RPQi is the reference point quotient of element i; RPi represents a specific toxicity endpoint or toxicological reference point for a specific critical event of element i; UFi represents the uncertainty coefficient of the corresponding toxicological reference point for element i. To assess the potential cumulative risk for each endpoint posed by more than one heavy metal, the adverse health risks that would result from a hypothetical sub-threshold exposure to several heavy metals at the same time are expressed in terms of the mRPI. The mRPI is the sum of the RPQ for each individual heavy metal: $$mRPI = RP{Q_1} + RP{Q_{\text{2}}} + RP{Q_3} + \ldots \ldots + RP{Q_n}.$$ If the mRPI value greater than 1 indicates an unacceptable combined risk, suggesting that prolonged exposure to this level is likely to lead to adverse health effects. Conversely, the mRPI value less than 1 indicates an acceptable combined risk, suggesting that the adverse health effects are unlikely to occur. Monte Carlo simulation method of health risk assessment While deterministic exposure assessment is widely used in health risk assessment, it can introduce extra uncertainty. To achieve a more precise estimation of the exposure level, the probabilistic assessment method, as recommended by the WHO/IPCS 38 , was adopted in this study. The Monte Carlo method (MCS) was utilized with the @RISK software v8.2 (from Palisade Coporation, Ithaca, NY, USA) using Latin hypercube sampling. As the probability distributions of the food samples may not follow normal or log-normal patterns due to the relatively small sample sizes for some foods, the @RISK software was employed to fit the distribution of food samples. The Akaike information criterion (AIC) was used to select the optimal function curve for describing the contaminant levels, and the mean was used to express the concentrations of heavy metal in foods. The statistical results were found to be stable when 100,000 Monte Carlo iterations were computed for each analysis, combining individual consumption and concentration data in a probabilistic manner. The health risk evaluation was based on the mean and 95th percentile values of the mRPI obtained from the simulation. Statistical analysis Data cleansing was performed by Excel 2016. Distributional fitting of heavy metal concentrations and food consumption, along with probabilistic assessments, was performed using the statistical software @RISK v8.2 (from Palisade Coporation, Ithaca, NY, USA). Heavy metal concentrations and food consumption expressed as both the mean and the 95th percentile. Results and discussion Results of screening and grouping for heavy elements Between 2017 and 2021, the Chongqing Food Safety Risk Monitoring System monitored 27 heavy metal elements, including Pb, Cd, As, Hg, Cr, Cu, praseodymium (Pr), neodymium(Nd), terbium (Tb), dysprosium (Dy), selenium (Se), europium (Eu), antimony (Sb), tin (Sn), vanadium (V), manganese (Mn), erbium (Er), cerium (Ce), samarium (Sm), ytterbium (Yb), lanthanum (La), promethium (Pm), holmium (Ho), lutetium (Lu), thulium (Tm), gadolinium(Gd) and nickel (Ni). Based on the screening principles described above, the elements Pm, Gd, Dy, Er, Ho, Yb, Ce, Sm, Lu, Nd, Eu, Tm, Pr, Tb and La were excluded due to a lack of toxicity information. The elements Ni, Cu, Se, V, Mn, Sb, and Sn were excluded due to incomplete monitoring in food groups. Dietary exposure to chromium below 10% of its health guideline value (TDI, 300 µg Cr(III)/kg b.w. per day) 39 was also excluded. Finally, the elements considered for assessment were Pb, Cd, As, Hg (Fig. 1 ). It’s worth noting that for Hg, both inorganic Hg (iHg) and organic Hg compounds, especially the methyl form (MeHg), have different toxicities. iHg primarily affects the kidneys, while MeHg targets the nervous system. Therefore, they were considered separately in this study. Additionally, it’s worth mentioning that the most toxic forms of As are its inorganic compounds, whereas some organic As compounds are relatively non-toxic. Therefore, this study exclusively focused on inorganic As (iAs). Fig. 1 We use the weight of evidence (WoE) approach approach for grouping chemicals into assessment groups using hazard-driven criteria. For full details, the reader is referred to the Fig S1 . Compiling the collected hazard data, including specific effects from subchronic toxicity studies, associated target organs, and reference points for Pb, Cd, As, and Hg, into evidence fragments and lines of evidence, we identified specific dose-response relationships for Pb, Cd, iAs, Hg in the kidney and nervous system, as shown in Table 1 . In addition, epidemiological data also suggested a causal relationship between Pb, Cd, As, Hg and kidney and nervous system damage 10 , 11 , 12 , 13 . While the mechanisms and adverse outcome pathways of neurotoxicity and nephrotoxicity remain unknown, they probably share similarities, as they act on the same cellular processes, such as oxidative stress or enzyme disruption due to metal replacement. For each chemical Pb, Cd, As and Hg, a semi-quantitative scale was applied to the weighing and integration of the four LOEs while assessing reliability, relevance and consistency of each LOE as low (*), moderate (**) and high (***). Expert judgement was then applied to conclude on the probability of membership to the assessment group (Table S9). Table S10 and Fig S2 summarise the WoE assessment for the grouping of chemicals Pb, Cd, As and Hg (associated with neurological damage) into common assessment group neurotoxicity and Pb, Cd, As and Hg (associated with renal damage) into common assessment groups nephrotoxicity. Table 1 Toxicological reference points (RP) on nephrotoxic and neurotoxicity effects and determined uncertainty factors (UF). Methodology discussion In a person’s life, we are constantly exposed to low concentrations of chemical mixtures over extended periods. Government agencies and international organizations, such as WHO/IPCS, EFSA, and the EPA, have recognized the adverse health risks of exposure to mixtures and proposed frameworks and guidance for assessing the cumulative risk of exposure to such chemicals 40 , 41 , 42 . Nevertheless, some limitations and challenges to the current approach remain to be addressed. These include the insufficient availability of toxicity study data for most evaluated substances, the absence of a cumulative risk assessment methodology for evaluating interactions, and a lack of accurate and effective grouping methods 1 . Recently, EFSA issued two methodological guidance documents to harmonize the risk assessment approach for joint exposures to multi-chemicals. The first document outlines principles for risk assessment of joint exposure to multi-chemicals and explores the methodology of risk assessment implementation 2 . The second guidance document provides scientific criteria for grouping chemicals into assessment groups, utilizing hazard-driven criteria and prioritization methods based on exposure and risk 26 . The hazard-driven approach addresses the limitations of inaccurate grouping, which may lead to overestimation or underestimation in risk assessment. This approach is based on the component-based method, which employs dose addition as the default assumption 43 . Currently, several methods are used in the component-based approach to determine risk, each with its own advantages and disadvantages. These include relative potency factor (RPF), reference point index (RPI), point of departure Index (PODI), hazard index (HI), toxic equivalency factor (TEF) and combined margin of exposure (MOET) 40 , 42 , 44 . The mRPI was chosen for this study. HI is calculated by summing the exposure to each chemical divided by its respective reference dose (RfD) and is commonly used in cumulative risk assessment 40 , 45 . However, the RfD is derived from health guideline values based on the most sensitive endpoint. Since toxic endpoints cannot be considered separately, HI may not be as applicable for a hazard-driven approach. TEF and RPF belong to normalization methods and depend on selection an index chemical to normalize the potencies of other members in the group. TEF has been used for dioxins and other aryl hydrocarbons, while RPF was mainly used for pesticides 46 , 47 . In recent studies, the RPF method has also been applied to assess the accumulation risk of heavy metals 17 , 34 . However, RPF is generally not suitable for food contaminants due to the lack of well-founded toxicological data on relative potency or compound interactions. The RPF method depends heavily on the adequacy of the chemical toxicology data and the choice of the indicator chemical. mRPI can be seen as an extension of RPI or PODI, with the main difference being the proposal of a corresponding uncertainty factor for each substance in mRPI, while RPI or PODI uses a single overall uncertainty factor 30 , 48 . The mRPI method improves risk estimation accuracy by defining the uncertainty factor based on specific studies and endpoints, suggesting that it might be a more appropriate method for cumulative risk assessment based on a hazard-driven approach. Concentrations of heavy metals in diverse food The mean values for four heavy metal elements are shown in Table 2 , and the P95 and function fit results are shown in Table S1 -S4. The mean concentration of Pb in foodstuffs was 0.0194–0.0295 mg/kg, with a total detection rate of 29.7%. These values were lower than the mean concentration of Pb in foodstuffs (0.0433 mg/kg) and the total detection rate (71.6%) of 6,339 food samples in Guangzhou from 2014 to 2017 49 . Pb concentration varied significantly among different food categories. Dried legumes had the highest mean concentration of lead (0.0668–0.0975 mg/kg), followed by nuts (0.0584–0.0601 mg/kg), leafy vegetables (0.0476–0.0597 mg/kg) and rice products (0.0471–0.0543 mg/kg), and the lowest mean level was found in milk and dairy based products (0.0064–0.0159 mg/kg). Among them, the mean concentration levels of rice, leafy vegetables, root and tuber vegetables, and eggs and their products were lower than the levels found in similar foods in Jiangsu Province from 2007 to 2010 50 . This study also revealed that Pb concentrations in cereals and cereal products (0.0211–0.0354 mg/kg), vegetables and vegetable products (0.0238–0.0336 mg/kg), and meat and meat products (0.0140–0.0237 mg/kg) were higher than those reported by Malavolti et al. (0.0114, 0.0249, 0.0125 mg/kg) 51 and Pan et al. (0.005–0.012, 0.017–0.022, 0.014–0.018 mg/kg) 52 . According to the maximum levels of contaminants in food published by the National Health Commission of the People’s Republic of China / the China Market Supervision Administration 27 , the mean concentrations of Pb in all food categories were below the prescribed legal limits. Similarly, the mean concentrations of Pb in all types of vegetables, fruits, rice, livestock meat, poultry meat, fish and milk and dairy based products were below the permitted maximum levels or guideline levels for contaminants in food established by the Codex Alimentarius Commission 53 . Table 2 Lower, median and upper bound of the mean concentration of heavy metals in diverse food categories. Cd contamination in food is widespread. As shown in Table 2 , the mean concentration of Cd in 5206 food samples ranged from 0.0219 to 0.0228 mg/kg, and the overall detection rate was 53.7%. These values were lower than the mean concentration of Cd in 4039 food samples (0.159 mg/kg) and the overall detection rate (76.1%) reported in Guangzhou from 2013 to 2015 54 , as well as the mean concentration of Cd in 228,687 food samples (0.049 mg/kg) and the overall detection rate (64.3%) reported in China from 2011 to 2015 55 . A comparison of elemental Cd concentrations in foodstuffs showed significant variations among different types of food. Nuts had the highest concentration of 0.2383 mg/kg, which was much higher than the value reported by Song et al. (0.029 mg/kg) 55 . This was followed by edible livestock and poultry offal (0.0919–0.1462 mg/kg) and the rice products (0.0740–0.0742 mg/kg), while the lowest mean levels were found in livestock meat (0.0007–0.0025 mg/kg). Other food categories ranged from 0.0014 to 0.0527 mg/kg. Plant-derived foods such as cereals and vegetables, especially rice and leafy vegetables, are usually the main sources of chronic Cd exposure in the diet due to the high absorption capacity of Cd by plants 56 . The mean Cd concentration in rice (0.0497–0.0502 mg/kg) in this study was lower than the Maximum Allowable Levels (MAL) set by the China Market Supervision Administration (0.2 mg/kg) 27 or the Codex Alimentarius Commission (0.4 mg/kg) 53 , but higher than the levels found in Bangladesh (0.044 mg/kg), Cambodia (0.006 mg/kg), Italy (0.038 mg/kg), and France (0.01 mg/kg) 57 . This suggests that cadmium needs constant attention. The mean levels of Cd in all vegetable varieties under the three scenarios of LB, MB, and UB were lower than the MALs set by the China Market Supervision Administration (0.1–0.2 mg/kg) 27 or CAC (0.05–0.2 mg/kg) 53 . As is present in food in both inorganic and organic forms, and inorganic arsenic is more toxic than organic arsenic 58 . As data obtained in NMPC was total As, the As concentrations presented in the article refer to total As. The results showed that the mean concentrations of As in 4345 food were 0.0206–0.0403 mg/kg, with an overall detection rate of 36.5%. The highest As levels in all food categories were found in fish and their products (0.0811–0.1180 mg/kg), which were higher than those found in fish from a town in Jiangsu Province (0.05 mg/kg) in China 59 , but lower than those found in fish from European countries (1.4526–1.4529 mg/kg) 11 . According to the latest national standard in China, the MAL of As in fish and their products is 0.1 mg/kg 27 , and the level of As contamination under the UB scenario exceeds this limit. Seafood is considered a major source of As in the human diet, highlighting the importance of addressing As contamination in fish and their products. Rice (0.0838–0.0848 mg/kg) and rice products (0.0447–0.0459 mg/kg) followed with relatively high As levels, while brassica vegetables had the lowest mean levels (0.0001–0.0077 mg/kg). Rice is one of the main staple foods in China. According to the study by EFSA 60 , grains, particularly rice and rice products, are a significant source of human dietary exposure to As. Compared to other regions in China, the mean As content in rice was lower than that in a town in Jiangsu Province (0.104 mg/kg) 59 , Chengdu (0.188 mg/kg) 61 , and Taiwan (0.17 mg/kg) 62 , but higher than that in Jilin Province (0.04 mg/kg) 63 . Compared to foreign countries, the mean As content in rice was lower than that in Vietnam (0.115 mg/kg) 64 , Iran (0.16 mg/kg) and Mexico (0.18 mg/kg) 65 , but higher than that in Nepal (0.0434 mg/kg) 66 , Sri Lanka (0.077 mg/kg) 67 . In order to reduce the potential health risks associated with As intake, it is recommended that the relevant authorities further strengthen the monitoring and management of arsenic contamination in rice, fish and their products. The mean level of Hg in 4378 foods samples was 0.0024–0.0039 mg/kg, significantly lower than the levels of the other three heavy metals included, with an overall detection rate of 22.1%. In this study, the lowest mean Hg levels were found in legumes vegetables (0.0006–0.0025 mg/kg) while the highest mean levels were found in fish and their products (0.0184–0.0285 mg/kg). These levels were lower than the mean concentrations of Hg in fish from Guangxi (0.04 mg/kg) and Hainan (0.04 mg/kg) in China, as reported by Wang et al. 68 , and in fish and their products from Finland (0.085–0.199 mg/kg), as reported by the Suomi et al. 69 . Furthermore, the mean concentrations of Hg in cereals and cereal products (0.002–0.0036 mg/kg), vegetables and vegetable products (0.0011–0.0027 mg/kg), meat and meat products (0.0024–0.0057 mg/kg), milk and dairy based products (0.0011–0.0026 mg/kg), eggs and their products (0.0012–0.0031 mg/kg) and fruits (0. 001–0.0028 mg/kg) were lower than those found in similar foods in the study by Qing et al. 70 . Food consumption of the survey Based on the summary of the questionnaire, the daily consumption of different food categories among Chongqing residents in this study is shown in Table 3 (detailed information and function fitting results are shown in Table S5). Except for nuts and food for special dietary uses, the 3-day consumption of various food categories ranged from 48.99 g to 972.41 g. The ranking of the eight categories was as follows: cereals and cereal products > vegetable and vegetable products > meat and meat products > milk and dairy based products > fruits > fish and their products > eggs and their products > beans and bean products. By comparison 45 , the average consumption of cereals and cereal products is basically consistent with the Yangtze River Delta region (331 g/d), lower than Beijing (422 g/d), while the average consumption of vegetable and vegetable products is lower than Beijing (491 g/d) and the recommended value of the 2016 Chinese Dietary Guidelines (400 g/d), and higher than the national average level of 2020 (270 g/d); the average consumption of meat and meat products is higher than the national average in 2020 (74 g/d) and Beijing (115 g/d). The 2022 Chinese Dietary Guidelines recommend consuming 200–300 g of fresh fruits, 300 g of dairy or dairy products, and 50 g of eggs per day 71 . Overall, the intake of fruits, milk and dairy based products, eggs, and beans and bean products is relatively low. It is recommended that residents in Chongqing increase their intake of those foods in the future. Notably, the residents of Chongqing reported zero consumption of nuts and nut products as well as baby food. This could be attributed to various factors such as seasonal influences, individual dietary habits, and the timing of the survey. Table 3 Daily food consumption of Chongqing residents (g/3 day). Health risk assessment of dietary heavy metal exposure The mRPI values for neurotoxic effect at mean exposure and high exposure levels for the four included heavy metals in 24 types of commercially available foods were 0–0.383 and 0–1.279 (Fig. 2 ), respectively (detailed mRPI results are shown in Table S6-S8). These values were calculated based on toxicological reference points derived from benchmark dose lower bound on neurotoxic effects. The mRPI values for nephrotoxic effect at mean exposure and high exposure levels were 0–0.503 and 0–1.611 (Fig. 3 ), respectively. These values were calculated based on toxicological reference points derived from benchmark dose lower bound or no observed adverse effect level on nephrotoxic effect. Fig. 2 The mRPI values of heavy metals from 24 types of food for neurotoxicity in Chongqing residents. (a, c, e) Average exposure level (mean). (b, d, f) High exposure level (P95). Compared to the mRPI values for neurotoxic effect, the mRPI values of nephrotoxic effect in all types of food were higher than that in neurotoxic. The mRPI values of neurotoxic effect and nephrotoxic effect in all single types of foods were well below 1 at the mean exposure level, while the mRPI values for the neurotoxic effects of rice and the nephrotoxic effects of rice and leafy vegetables were greater than 1 at high exposure level. This indicated that consumption single types of foods had a low likelihood of posing a risk of nephrotoxic or neurotoxic effect at the mean exposure level. However, at high exposure levels, consumption rice or leafy vegetables alone may potentially cause health damage to the nervous and urinary system. This finding suggested higher potential health risks associated with dietary heavy metal exposure in populations with high exposure levels. It can also be seen from Figs. 2 and 3 that among all the foods investigated, rice, leafy vegetables and wheat flour products were the top three foods affecting both neurotoxic and nephrotoxic effects. The combined mRPI values for neurotoxicity and nephrotoxicity, classified by the included heavy metals, are presented in Figs. 4 and 5 , respectively (detailed mRPI results are shown in Table S6-S8). For neurotoxicity, the RPQ/mRPI ranges were as follows: 0.643–3.462 for Pb, 0.116–0.866 for Cd, 0.112–0.480 for iAs, 0.001–0.035 for MeHg, and 0.922–4.835 for mRPI (Fig. 4 ). Based on these findings, the order of risk for individual heavy metals can be listed as Pb > Cd > As > Hg. At mean exposure levels in both the MB and UB scenarios, the RPQs for neurotoxicity from individual heavy metal element exposures did not exceed 1. However, the mRPIs for mean exposure levels exceeded 1. In high-exposure level scenarios, the mRPI values for neurotoxicity associated with the four metals consistently exceeded 1, even under the best-case scenario (LB). The results suggested that there may be a potential neurotoxic risk from the cumulative exposure of heavy metal for local populations via the daily dietary. It is worth noting that at high exposure levels, the RPQ for Pb exceeded 1 in the LB, MB, and UB scenarios, indicating a potential neurotoxic risk for the residents of Chongqing at high exposure levels. Fig. 4 The mRPI values for neurotoxicity calculated by 24 types of food for Pb, Cd, iAs, MeHg and total 4 heavy metals in Chongqing residents. (a, c, e) Average exposure level (mean). (b, d, f) High exposure level (P95). For nephrotoxicity, the combined mRPIs were as follows: 0.510–2.748 for Pb, 0.784–4.223 for Cd, 0.007–0.029 for iAs, 0.005–0.032 for iHg, and 0.922–4.835 for mRPI (Fig. 5 ). Based on these values, the order of risk for individual heavy metals was Cd > Pb > Hg > As. In both the mean and high exposure levels in LB/MB/UB scenarios, the combined PRI values for the nephrotoxicity exceeded 1. This indicates that there might be a potential nephrotoxic risk for residents (both the mean and high exposure levels) form the cumulative exposure of heavy metal via the daily dietary. Furthermore, for nephrotoxicity, the potential health risk is mainly attributed to two elements, Pb and Cd. The RPQ values for Cd exceeded 1 under LB/MB/UB for the mean exposure scenario, and the RPQ values for both Pb and Cd exceeded 1 under LB/MB/UB for the high-exposure scenario, indicating that these two elements pose a potential nephrotoxic risk individually. Additionally, when considering common target organs, the co-exposure may leads to an increased risk of kidney injury. Comparing the combined mRPI values for neurotoxicity and nephrotoxicity, the combined mRPI value of nephrotoxicity was higher. This suggested that potential nephrotoxic risks through diverse food consumption may be more severe than neurotoxic risks. Contributions of heavy metals and foods to neurotoxicity and nephrotoxicity The relative contributions of heavy metals to neurotoxicity and nephrotoxicity at mean exposure level are presented in Fig. 6 . For neurotoxicity, Pb was the primary contributor to the mRPI (69.74 − 72.22%), followed by Cd with 17.44 − 18.05%. The contribution of As (represented by iAs) to the mRPI ranged from 9.24 to 12.13%, while Hg (represented by MeHg) accounted for less than 1%. Limiting exposure to Pb, as the major contributor to neurotoxicity, would have a more significant impact on protecting consumers from nervous system injury by heavy metals. Regarding nephrotoxicity, Cd was the main contributor to the total mRPI, accounting for 60.05 − 60.09%. Pb accounted for 39.08–39.01% of the mRPI at mean exposure level. The combined contribution of Hg (represented by iHg) and As (represented by iAs) is less than 1%. Clearly, Pb and Cd contributed more than 80% of the mRPI and were the dominant sources of risk for kidney and nervous system injury. The results of the above study were similar to the research reported by Wang et al. and Suomi et al. 17 , 34 . The contributions of different foodstuffs to the PRI values for neurotoxicity and nephrotoxicity were calculated at the mean exposure level (Fig. 7 ). For neurotoxicity, rice was the primary contributor to the mRPI values in all three exposure scenarios (26.8%, 29.71% and 26.18% for the LB, MB, and UB, respectively). Leafy vegetables ranked second, followed by wheat products, all surpassing 10% in contribution. Other food categories made relatively lower contributions, ranging from less than 8.74%. Regarding nephrotoxicity, all food categories exhibited similar contributions to the mRPI values as in neurotoxicity and rice, leafy vegetables and wheat products are the primary contributor. Other food categories made relatively lower contributions, less than 10%. In the present study, the combined contribution of rice and various vegetables ranged from 61.29 to 67.29%, indicating that the consumption of rice and vegetables contributes significantly to the overall risk. This because the main feature of the traditional Chinese dietary structure is the high consumption of rice and vegetables, which are prone to absorbing heavy metal elements from soil, such as Cd 72 . Fig. 6
Monte Carlo Frequently Asked Questions (FAQ)
When was Monte Carlo founded?
Monte Carlo was founded in 2019.
Where is Monte Carlo's headquarters?
Monte Carlo's headquarters is located at 548 Market Street, San Francisco.
What is Monte Carlo's latest funding round?
Monte Carlo's latest funding round is Series D.
How much did Monte Carlo raise?
Monte Carlo raised a total of $236M.
Who are the investors of Monte Carlo?
Investors of Monte Carlo include Accel, Notable Capital, Redpoint Ventures, Salesforce Ventures, ICONIQ Growth and 5 more.
Who are Monte Carlo's competitors?
Competitors of Monte Carlo include Anomalo, Bigeye, Cribl, Timeseer, Soda and 7 more.
What products does Monte Carlo offer?
Monte Carlo's products include Monte Carlo Data Observability Platform.
Who are Monte Carlo's customers?
Customers of Monte Carlo include Fox, Shipt, ShopRunner and Vimeo.
Loading...
Compare Monte Carlo to Competitors

Anomalo provides automated AI data quality monitoring for the enterprise sector. The company has a platform that identifies and resolves data quality issues using machine learning. Anomalo's solutions are available for businesses that need to maintain data integrity and compliance across various sectors. Anomalo was formerly known as Data Gravity. It was founded in 2018 and is based in Palo Alto, California.

Ataccama is a software company that provides data management solutions, focusing on data quality, master data management, and data governance across various industries. The company offers services including data discovery, data quality checks, master data consolidation, and data governance programs. Ataccama serves sectors such as banking, insurance, finance, healthcare, retail, government, life sciences, telecom, and transportation. It was founded in 2007 and is based in Toronto, Ontario.
BaseCap is a company focused on data health tracking and problem-solving within the data analysis and management sector. The company offers a platform that validates, automates, and transforms critical business information to ensure data integrity and streamline operations. BaseCap primarily serves industries such as mortgage, insurance, education, aerospace manufacturing, utilities, and financial services. It was founded in 2012 and is based in New York, New York.
Datafold specializes in automated testing solutions for data engineers within the data analytics and quality assurance sectors. The company provides tools for data diffing, column-level lineage, and continuous integration testing to ensure data quality throughout development, deployment, and migration processes. Datafold's solutions are designed to help data teams deploy pipelines with confidence, accelerate development, and maintain high data quality standards. It was founded in 2020 and is based in New York, New York.

Acceldata focuses on enterprise data observability within the data management and analytics industry. The company offers a platform that monitors enterprise data systems, ensuring data reliability, optimizing costs, and providing observability for compute and query operations. Acceldata's platform is designed to support data-driven enterprises by providing insights into data pipelines, quality, and performance across cloud, on-premises, and hybrid environments. It was founded in 2018 and is based in Campbell, California.
Ample Insight is a company specializing in data science and AI, offering services across various sectors including technology, healthcare, and consumer goods. The company provides consulting and implementation services in AI and machine learning, data engineering and architecture, as well as ensuring data integrity and governance. Ample Insight serves clients in industries such as healthcare, consumer packaged goods, and e-commerce, among others. It was founded in 2018 and is based in Toronto, Ontario.
Loading...