
Carbon
Founded Year
2013Stage
Shareholder Liquidity | AliveTotal Raised
$692MMosaic Score The Mosaic Score is an algorithm that measures the overall financial health and market potential of private companies.
-14 points in the past 30 days
About Carbon
Carbon is a 3D printing technology company that specializes in 3D printing services and additive manufacturing across various sectors. The company offers an integrated platform that includes end-use production materials, software, and production-scale 3D printers designed to accelerate the product development process from idea to production. Carbon primarily serves industries such as automotive, consumer goods, industrial manufacturing, and life sciences, including dental product fabrication and custom orthodontic solutions. It was founded in 2013 and is based in Redwood City, California.
Loading...
ESPs containing Carbon
The ESP matrix leverages data and analyst insight to identify and rank leading companies in a given technology landscape.
The industrial 3D printing — polymers market involves the use of additive manufacturing techniques to produce three-dimensional objects using polymer-based materials. This technology offers advantages such as design flexibility, rapid prototyping, and cost-effective production. The market is driven by the growing demand for customized and complex components across various industries, including aut…
Carbon named as Challenger among 15 other companies, including Stratasys, 3D Systems, and Formlabs.
Loading...
Research containing Carbon
Get data-driven expert analysis from the CB Insights Intelligence Unit.
CB Insights Intelligence Analysts have mentioned Carbon in 4 CB Insights research briefs, most recently on Dec 18, 2023.
Expert Collections containing Carbon
Expert Collections are analyst-curated lists that highlight the companies you need to know in the most important technology spaces.
Carbon is included in 5 Expert Collections, including Unicorns- Billion Dollar Startups.
Unicorns- Billion Dollar Startups
1,258 items
Conference Exhibitors
5,501 items
HLTH is a healthcare event bringing together startups and large companies from pharma, health insurance, business intelligence, and more to discuss the shifting landscape of healthcare
Tech IPO Pipeline
568 items
Advanced Manufacturing
6,494 items
Companies in the advanced manufacturing tech space, including companies focusing on technologies across R&D, mass production, or sustainability
Advanced Manufacturing 50
50 items
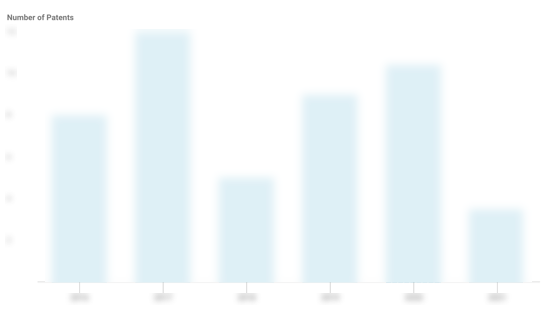
Carbon Patents
Carbon has filed 623 patents.
The 3 most popular patent topics include:
- 3d printing
- 3d printing processes
- chemical processes
Application Date | Grant Date | Title | Related Topics | Status |
|---|---|---|---|---|
7/7/2020 | 11/26/2024 | Chemical processes, Gas technologies, Industrial gases, Filters, Waste treatment technology | Grant |
Application Date | 7/7/2020 |
|---|---|
Grant Date | 11/26/2024 |
Title | |
Related Topics | Chemical processes, Gas technologies, Industrial gases, Filters, Waste treatment technology |
Status | Grant |
Latest Carbon News
Jan 21, 2025
Abstract The acceleration of urbanization has significantly exacerbated climate change due to excessive anthropogenic carbon emissions and air pollutants. Based on data from 281 prefecture-level cities in China between 2015 and 2021. The spatiotemporal co-evolution of urban carbon emissions and air pollutants was analyzed through map visualization and kernel density estimation, revealing non-equilibrium and heterogeneity. Extreme gradient boosting (XGBoost) multiscale geographically weighted regression models(MGWR) and SHAP theory from game theory were employed to deeply investigate the disparities in relevance, spatial heterogeneity, and multiscale fluctuations of carbon emissions and air pollution. The main results are summarized as follows: (1) Between 2015 and 2018, CO2 emissions exhibited significant fluctuations, while SO2 and PM2.5 concentrations decreased markedly. (2) The XGBoost-SHAP model identified seven key driving factors, demonstrating high precision, the SHAP model is used to explain the model and reveal the influence of driving factors on carbon emissions. (3) The concentrations of CO2, SO2, and PM2.5 were positively correlated, the influence of each factor exhibited significant spatiotemporal differences, with varying directions of fluctuation across different regions. Thus, the symbiotic relationship between carbon emissions and air pollutants can inform decision-making for regional planning and sustainable urban development. Introduction Rapid global economic growth has increased environmental pollution, including greenhouse gas emissions and ecological damage 1 . Fossil fuel combustion, a major contributor, raises carbon dioxide levels and global warming 2 . China, the largest energy consumer, relies heavily on high-carbon fuels, with energy-intensive industries concentrated in urban areas. While these cities drive socio-economic growth 3 , they also suffer from severe pollution due to rapid urbanization. Chinese cities are crucial for achieving the nation’s carbon peak by 2030 and neutrality by 2060, in line with the Paris Agreement 4 . To meet these targets, China is pursuing a green transformation through industrial restructuring, technological innovation, and policy integration. The strong link between carbon and air pollutant emissions supports their joint reduction, advocating for integrated co-control strategies 5 that enhance cost-efficiency. Understanding spatiotemporal trends and key drivers is essential for optimizing these efforts 6 . Research on the spatiotemporal evolution of carbon emissions and air pollutants ranges from global to urban scales 7 . Common methods include geographic Markov chains, exploratory data analysis, the Gini coefficient, and standard deviation ellipses, with the latter being preferred for spatial layout and PM2.5 distribution analysis 8 . Notable studies include Duman et al. 's analysis of emission imbalances in 335 Chinese cities 9 and Huang et al. 10 real-time emission estimation method. Yang et al. 11 measured carbon inequality using the Gini coefficient in Northwest China, and Cheng et al. 12 applied it with cluster analysis to urban agglomerations. Liu et al. 13 explored emission dynamics in Qinghai with spatial Markov chains. Despite capturing spatial relationships, these methods often miss detailed temporal variations and nationwide urban emissions. Factors influencing emissions and pollutants include socioeconomic aspects such as climate change’s impact on economic growth 14 , the digital economy 15 , energy efficiency 16 , population growth 17 , industrial production 18 , and carbon intensity 19 . Industrial structure 20 and technological innovation 21 are vital for reducing emissions and ensuring sustainability. Coordinating economic growth with environmental protection requires optimizing industrial structures and advancing innovation. However, many studies address these factors independently, missing their synergistic effects. Analytical methods such as STIRPAT theory 22 ,spatiotemporal decomposition 23 , LMDI 24 , and super-efficient data envelopment analysis 25 are used to assess emissions and efficiency. To address the gap left by conventional econometric models that often overlook local spatiotemporal heterogeneity, this study applies the XGBoost model, which captures nonlinear relationships, alongside SHAP value theory for nuanced factor analysis. However, recognizing XGBoost’s limitations due to its stationary parameters, the study introduces multiscale geographically weighted regression (MGWR) to provide a more precise spatial heterogeneity analysis across varying scales. This approach corrects the errors introduced by both XGBoost and traditional geographically weighted regression (GWR), where fixed bandwidths or scales may introduce inaccuracies. This paper utilizes kernel density estimation to analyze the spatiotemporal evolution of carbon emissions and air pollutants. It then applies the XGBoost-SHAP model to identify key drivers and spatial variability of urban emissions. Finally, the MGWR model examines spatial multiscale heterogeneity. The study uses emissions data for CO2, SO2, and PM2.5 from 281 Chinese cities for 2015, 2018, and 2021. Figure 1 outlines the methodological framework. The goal is to advance low-carbon city development by integrating the impacts of air pollutants and carbon emission changes. Fig. 1 Spatiotemporal evolutionary method Spatiotemporal evolution is a model used to assess the spatial distribution and temporal trends of pollutants, helping to research and simulate changes in carbon emissions and atmospheric pollutants. Kernel density estimation (KDE) is a nonparametric method for estimating the probability density function of a random variable and is commonly used in data analysis to understand and visualize data distributions 26 . It assumes a set of independent and identically distributed sample data, the formula for KDE is expressed in Eq. ( 1 ): $$\mathop f\limits^{ \wedge } (x) = \frac{1}{n}\sum\limits_{i = 1}^{n} {K_{h} (x - x_{i} )}$$ (1) where \(\mathop f\limits^{ \wedge } (x)\) is the density estimate \(x\), \(K_{h} ( \cdot )\) is the kernel function, and \(h\) is a bandwidth parameter used to control the smoothing degree. The kernel function \(K_{h} (\cdot)\) is symmetric and integrates to 1, due to its outstanding smoothness and statistical properties, the Gaussian kernel function is frequently used in kernel density estimation. Its simple calculation makes it suitable for most practical applications. XGBoost-SHAP algorithm Linear models, such as spatial econometric models and linear regression, are commonly used to analyze the relationship between carbon emissions and air pollution factors. In contrast, this study utilizes Extreme Gradient Boosting (XGBoost), an advanced machine-learning algorithm known for its high accuracy and adaptability in evaluating these factors 27 . Shapley Additive Explanations (SHAP) is a game theory-based method for interpreting machine learning model outputs 28 . SHAP assigns contribution values to each feature, reflecting its impact on the model’s predictions 29 , providing both global and local interpretations for each feature. XGBoost is a complex ensemble learning method with powerful predictive capabilities, but its internal mechanisms are difficult to interpret directly. The reason for choosing XGBoost is its ability to effectively handle large-scale data and automatically identify the most influential features on the prediction results. Through feature importance scores, key factors are initially screened, laying the foundation for subsequent analysis. Additionally, the introduction of SHAP values addresses the interpretability limitations of the XGBoost model. SHAP is a tool for interpreting model outputs based on Shapley value theory, which fairly distributes the contribution of each feature. The core idea is to treat the model output as a weighted sum of multiple features, ensuring the additivity and consistency of feature contributions. By using SHAP values, we can clearly identify the specific impact of each feature in the analysis, providing not only local interpretability but also revealing potential interaction effects between features. Combining XGBoost with SHAP reduces model complexity and enhances the focus of the analysis. It also allows for a deeper investigation of how these key features influence carbon emissions under different conditions, offering more practical insights. The scientific validity and effectiveness of this approach have been widely validated in research across multiple fields, such as bioinformatics, sustainability studies, and agriculture, ensuring the transparency and credibility of the results. Multiscale geographically weighted regression models Despite similarities in urban form among neighboring cities, differences in resources, geography, industry, and economics can cause notable variations in carbon emissions and air pollutants 30 . Multiscale Geographically Weighted Regression (MGWR), an extension of the Geographically Weighted Regression (GWR) model, addresses this by analyzing spatial data with varying scales 31 . The GWR model is detailed in Eq. ( 2 ). $$y_{i} = \beta_{0} (u_{i} ,v_{i} ) + \sum\limits_{k = 1}^{p} {\beta_{k} (u_{i} ,v_{i} )} x_{ik} + \varepsilon_{i}$$ (2) where \((u_{i} ,v_{i} )\) indicates the geographic coordinate of the \(i\) observation point, \(\beta_{k} (u_{i} ,v_{i} )\) indicates \((u_{i} ,v_{i} )\) the regression coefficient at the location, \(x_{ik}\) indicates the explanatory variable, and \(\varepsilon_{i}\) means the error term. The MGWR is formulated in Eq. ( 3 ). $$y_{i} = \beta_{0} (u_{i} ,v_{i} ,b_{0} ) + \sum\limits_{k = 1}^{p} {\beta_{k} (u_{i} ,v_{i} ,b_{k} )} x_{ik} + \varepsilon_{i}$$ (3) where \(b_{0} ,b_{1} , \ldots ,b_{p}\) is the corresponding bandwidth parameter reflecting the spatial range of influence of each variable. Carbon emission accounting The carbon emission estimation methods employed in this study primarily derive from the "Greenhouse Gas Protocol: Accounting and Reporting Standard" (GHG Protocol), which was jointly published by the World Resources Institute (WRI) and the World Business Council for Sustainable Development (WBCSD), providing standards and frameworks for greenhouse gas emission accounting that clarify carbon emissions. It specifies the accounting methods for Scope 1 and Scope 2 emissions. This study classifies carbon emissions primarily according to these scopes: Scope 1 (direct carbon emissions) refers to emissions from fossil fuel combustion, industrial production processes, and related greenhouse gases; Scope 2 (indirect carbon emissions) refers to emissions from purchased electricity, heating, and related activities. The specific estimation methods are as follows. (1) Direct carbon emission estimation method Fuel types (such as coal, natural gas, gasoline, etc.) are selected based on the "IPCC 2006 Guidelines for National Greenhouse Gas Inventories" or the Chinese greenhouse gas emission inventory for emission factors (EF). The emission factor for each type of fuel is expressed in tons of CO₂ per unit of fuel. The calculation formula is as Eq. ( 4 ). $$E_{Scope1} = \sum {(A \times EF_{1} )} + \sum {(B \times EF_{2} )} + Other$$ (4) \(A\) represents the consumption of fuel,\(EF_{1}\) which represents the emission factor for fossil fuel combustion.\(B\) denotes the industrial process emissions,\(EF_{2}\) which represents the industrial emission factor. (2) Indirect carbon emission estimation method Emission factors are selected based on the national or regional grid emissions (typically published by power companies or environmental protection agencies), which are typically expressed in tons of CO₂ per kilowatt-hour. The calculation formula is as Eq. ( 5 ). $$E_{Scope2} = \sum {(C \times EF_{3} )} + \sum {(D \times EF_{4} )} + \sum {(E \times EF_{5} )} + Other$$ (5) \(C\) represents the purchased electricity consumption (in kilowatt-hours),\(EF_{3}\) which denotes the emission factor for electricity.\(D\) denotes the heating consumption,\(EF_{4}\) which represents the emission factor for heating.\(E\) denotes the cooling consumption,\(EF_{5}\) which represents the emission factor for cooling. Factor identification In recent years, urbanization has accelerated, with population density, urban economic density, level of economic development, and urbanization level (of a city) often serving as key indicators of urban growth and morphology 32 , 33 . China is in a critical phase of industrial restructuring, with the "China Economic and Social Development Report 2022" emphasizing that optimizing the industrial structure is essential for sustainability and transitioning to new economic drivers. Research on upgrading 34 , advancement 35 , and rationalization 36 of China’s industrial structure supports this shift. Omri et al. demonstrated that technological innovations reduce environmental pollution, making science and technology expenditure a crucial factor in analyzing carbon emissions and air pollutants 37 . Additionally, infrastructure development 38 and the green coverage rate of built-up areas 39 are key measures of urban greening efforts. In this study, 10 drivers of carbon emissions and air pollutants were selected from socio-economic, techno-structural, and urban construction factors: population density (X1), urban economic density (X2), level of economic development (X3), overall upgrading of industrial structure (X4), advanced industrial structure (X5), rationalization of industrial structure (X6), expenditure on science and technology (X7), infrastructure level (X8), urbanization level (X9), and green coverage rate of built-up area (X10). Table 1 provides a detailed description of the selected drivers and the formulas for their calculation. Table 1 Description of drivers of carbon emissions and air pollutants. Data sources This study analyzes panel data from 281 cities (excluding Xinjiang, Macao, Tibet, Taiwan, and Hong Kong) for 2015–2021. Between 2015 and 2021, the collection of relevant data was conducted in a systematic and comprehensive manner, particularly noted for the high consistency between local government statistics and national data. During this period, China implemented a series of air pollution control policies and carbon reduction targets, enabling the data from this timeframe to effectively reflect the impacts of these initiatives 40 . Additionally, the relative stability of economic development and social changes during these years facilitates a clearer analysis of causal relationships, thereby minimizing the influence of external variables on the results. Consequently, examining the changes within this period is essential for a nuanced understanding of the relationship between carbon dioxide emissions and air pollution. The data used in this study 41 , 42 , 43 , 44 , 45 can be found in Table 2 . During the data processing stage, the collected data was initially cleaned by employing interpolation to fill in missing values. Furthermore, data from various sources was standardized to a uniform emission unit, and normalization was applied to facilitate subsequent analyses. Table 2 Sources of various types of data. Carbon emissions and spatiotemporal evolution of atmospheric pollutants The choice of CO2, SO2, and PM2.5 as the primary focus of this study is based on their significant impacts on environmental quality and human health. These pollutants are often prioritized in air quality management and greenhouse gas control policies. Furthermore, the data for these three pollutants is relatively continuous and of high quality, making them suitable for this research. This selection does not imply that other pollutants are unimportant; rather, it reflects the choices made in terms of data availability and key analysis subjects to ensure the scientific rigor and stability of the study’s findings. Figure 2 illustrates the trend of carbon and air pollutant emissions in Chinese cities from 2015 to 2021. SO2 accounted for the largest share of the three pollutants in 2015, but it decreased annually thereafter. Meanwhile, CO2 emissions have increased each year, and although PM2.5 has remained relatively stable, it still exhibits a decreasing trend. The reduction in SO2 and PM2.5 proportions may be attributed to various emission reduction measures, whereas the increase in CO2 emissions could be due to the rising energy demand in China in recent years and the transitional phase of energy transformation. Fig. 2 In 2021, carbon emissions continued to rise, especially in Hebei and Shandong, indicating increased industrial activity, as shown in Fig. 4 . SO2 levels remained high in North, East, and Northeast China, while PM2.5 concentrations further declined in the North China Plain, Yangtze River Delta, and Central China, signaling continued progress in pollution control. From 2015 to 2021, CO2 emissions have consistently increased, indicating that emission reduction policies have not yet fully taken effect. SO2 concentrations have overall declined, showing the success of industrial controls, but remain high in some areas, highlighting the need for additional regulation. PM2.5 levels have generally decreased, particularly in developed and industrialized regions, reflecting effective air quality improvements. Despite these advancements, challenges in pollution control and emission reduction persist. Dynamics of carbon emissions and distribution of atmospheric pollutants The map-based visualization in " Carbon emissions and spatiotemporal evolution of atmospheric pollutants " section shows the spatial distribution of carbon emissions and air pollutants but does not capture the dynamics of absolute differences during urbanization. Therefore, further analysis using KDE is needed to assess the dynamic characteristics of regional distribution in China. Dynamic kernel density maps for urban carbon emissions, SO2, and PM2.5 in China from 2015 to 2021 are presented in Fig. 5 . Significant fluctuations in carbon emissions occur, with varying peaks reflecting industrial activity and urban expansion (Fig. 5 a). SO2 emissions notably decline after 2018 due to strict environmental policies, despite a peak between 2015 and 2018, with a clear reduction in high-density areas (Fig. 5 b). PM2.5 concentrations also fluctuate but generally decline, indicating improved air quality, especially after 2015–2016 (Fig. 5 c). Analysis of Fig. 4 reveals that changes in CO2, SO2, and PM2.5 from 2015 to 2021 reflect the impact of environmental policies and industrial adjustments on emissions. The downward trend indicates effective emission reduction due to state-enforced measures. Despite carbon emission research being more recent compared to air pollutant control, shared emission sources suggest that air pollutant control strategies provide valuable insights for managing carbon emissions. Fig. 5 Dynamic distribution of CO2, SO2 and PM2.5 emissions in Chinese cities((a) Dynamic distribution of CO2 emissions. (b) Dynamic distribution of SO2 Emissions. (c) Dynamic distribution of PM2.5 emissions). Determination of the level of importance of drivers influencing urban carbon emissions and air pollutants The modeling framework for determining the level of importance of urban carbon emissions and air pollutant drivers is shown in Fig. 6 . Fig. 6 Figures 8 and 9 display the attribution analysis maps and characteristic importance contribution maps of SHAP values for carbon emissions, SO2 and PM2.5 in Chinese cities. The analysis of carbon emissions reveals that population density (X1) and expenditures on science and technology (X7) exert the greatest influence on carbon emissions. Additionally, PM2.5 and SO2 positively affect carbon emissions, suggesting that higher pollutant concentrations are associated with increased carbon emissions. Figure 8 illustrates that expenditures on science and technology (X7) and an advanced industrial structure (X5) significantly impact SO2 concentration. CO2 and the overall upgrading of the industrial structure (X4) also have a pronounced effect on PM2.5. In contrast, infrastructure level (X8) and population density (X1) have a relatively minor impact on SO2, though they still contribute to some extent. The analysis of PM2.5 shows that SO2 concentration has a greater impact, with population density (X1) and advanced industrial structure (X5) positively influencing PM2.5. Additionally, CO2 and the overall upgrading of the industrial structure (X4) significantly affect PM2.5, suggesting that these factors contribute to PM2.5 emissions. Fig. 8 Table 3 demonstrates that the R2 values exceed 0.65 in all three years (2015, 2018, and 2021), indicating a good fit for the model. Furthermore, the MSE, RMSE, and MAE values are all below 0.05, suggesting that the model achieves high accuracy. Table 3 XGBoost-SHAP model evaluation. Based on the results of the analysis of factors influencing carbon emissions, SO2, and PM2.5, it can be concluded that significant mutual influences exist among these variables. Further analysis reveals that the level of economic development (X3), the overall upgrading of the industrial structure (X4), and the urbanization level (of a city) (X9) have relatively minor impacts on carbon emissions, SO2, and PM2.5. Consequently, these three indicators will be excluded from the subsequent heterogeneity analysis to enhance model accuracy. Optimizing indicator selection contributes to constructing a more precise and simplified model, thereby improving the analysis of the complex relationships between drivers and emissions of carbon and air pollutants. Spatial multiscale and heterogeneity of drivers affecting carbon emissions and atmospheric pollutants The heterogeneity of drivers for CO2, SO2, and PM2.5 in 2015, 2018, and 2021 was analyzed using the MGWR model. This method is primarily used to analyze spatial heterogeneity and does not directly address the issue of multicollinearity. Table 4 is a summary table and comparative analysis of the regression results for CO2, SO2, and PM2.5. The table includes the sample size of significant coefficients and the proportion of significant samples for each feature variable. The table shows that population density and urban economic density have the most significant impacts on carbon emissions and air pollution, while advanced industrial structure and rationalization of industrialization structure have a considerable effect on CO2 and PM2.5. Other variables, such as expenditure on the level of science and technology, infrastructure level, and green coverage rate of built-up areas, have a relatively weaker impact on pollutants but still play a certain regulatory role. Table 5 presents the bandwidths of variables affecting these emissions. In MGWR, bandwidths define the spatial extent of localized regression within weighting matrices: smaller bandwidths lead to more localized models, while larger ones include broader spatial data. The table shows stable bandwidths for expenditure on science and technology (280, 280, 280), (280, 280, 233), (280, 280, 279) and infrastructure (280, 280, 280), (280, 280, 280) across 2018 and 2021, suggesting consistent impacts on CO2, SO2, and PM2.5. However, population density (43, 280), urban economic density (116, 248), advanced industrial structure (45, 280), rationalized industrial structure (45, 249), and green coverage of built-up areas (79–249) display significant variability, indicating regional heterogeneity and complexity in their effects on pollutants. The regression coefficients from the MGWR analysis are detailed in supplementary material Tables S1 , S2 , and S3 . Table 4 Sample Size and Proportion of Significant Coefficients in the 2021 MGWR Regression Results. MGWR regression coefficients were employed to examine the spatial distribution of factors influencing CO2, SO2, and PM2.5 levels in Chinese cities for 2015, 2018, and 2021. As depicted in Fig. 10 for 2021, supplementary material Fig. S1 for 2015, and Fig. S2 for 2018, the regression coefficients illustrate the degree to which each driver affects carbon emissions. The color spectrum ranges from red (high impact) to blue (low impact). The regression coefficient’s sign indicates whether the driver is positively or negatively correlated with regional emissions. The spatial distributions of CO2, SO2, and PM2.5 appear consistent, with all MGWR coefficients being positive, indicating a correlation among the three pollutants. Fig. 10 Spatial distribution of MGWR coefficients for urban drivers in China, 2021((a) Spatial distribution of MGWR coefficients for CO2 with SO2, PM2.5, and drivers. (b) Spatial distribution of MGWR coefficients for SO2 with CO2, PM2.5, and drivers. (c) Spatial distribution of MGWR coefficients for PM2.5 with CO2, SO2, and drivers).
Carbon Frequently Asked Questions (FAQ)
When was Carbon founded?
Carbon was founded in 2013.
Where is Carbon's headquarters?
Carbon's headquarters is located at 1089 Mills Way, Redwood City.
What is Carbon's latest funding round?
Carbon's latest funding round is Shareholder Liquidity.
How much did Carbon raise?
Carbon raised a total of $692M.
Who are the investors of Carbon?
Investors of Carbon include GE Ventures, 40 North Ventures, Sequoia Capital, JSR, Hydra Ventures and 21 more.
Who are Carbon's competitors?
Competitors of Carbon include Markforged, Formlabs, Desktop Metal, Merit3D, Fast Radius and 7 more.
Loading...
Compare Carbon to Competitors

Formlabs develops and manufactures high-resolution stereolithography (SLA) and selective laser sintering (SLS) 3D printers. The company provides a range of printers, materials, and post-processing solutions for rapid prototyping, end-use part production, and manufacturing aids across various industries. Formlabs serves sectors such as engineering, manufacturing, automotive, aerospace, dental, medical, education, entertainment, and jewelry. It was founded in 2011 and is based in Somerville, Massachusetts.

Impossible Objects focuses on advanced composite-based additive manufacturing within the 3D printing industry. The company offers a proprietary technology that produces geometrically complex parts at faster speeds than traditional methods, utilizing materials such as carbon fiber, PEEK, and fiberglass. Impossible Objects primarily serves sectors that require durable components, including aerospace, automotive, electronics manufacturing, and healthcare. It was founded in 2011 and is based in Northbrook, Illinois.

Digital Alloys specializes in metal additive manufacturing technology. The company offers a unique metal 3D printing process known as Joule Printing™, which is designed for high-speed production and cost efficiency in manufacturing hard metal parts. Digital Alloys primarily serves manufacturers requiring robust metal components. It was founded in 2017 and is based in Burlington, Massachusetts.

9T Labs specializes in the manufacturing of strong, lightweight, and sustainable composite materials within various industries. The company offers an Additive Fusion Technology solution that enables the production of structural parts with a significant reduction in weight and cost compared to metal, while maintaining high performance in demanding environments. 9T Labs primarily serves sectors such as aerospace, automotive, medical, sporting goods, and education & research. It was founded in 2018 and is based in Zurich, Switzerland.

BigRep specializes in large-format 3D printing and operates within the industrial additive manufacturing sector. The company offers industrial 3D printers for functional rapid prototyping, tooling, and the creation of end-use parts, along with a filament dry cabinet to protect materials. BigRep provides a comprehensive suite of software for remote monitoring, data analytics, and easy tooling configuration, as well as expert training and support services to ensure optimal printer performance. It was founded in 2014 and is based in Berlin, Germany.

Aon3D specializes in industrial additive manufacturing solutions and focuses on thermoplastics for various sectors. The company offers a range of 3D printers and software designed to create functional parts using advanced materials such as PEEK and ULTEM. Aon3D primarily serves the aerospace, manufacturing, and federal & military industries with its innovative 3D printing technology. It was founded in 2015 and is based in Montreal, Canada.
Loading...